- The Land Letter
- Posts
- Does History Repeat Itself?
Does History Repeat Itself?
Looking at the Case-Shiller Index Then and Now

As part of our process, anytime we get a new listing we make it a point to call the surrounding owners and let them know the property is on the market (assuming our client has no sensitivities to it). One of those calls yesterday turned into a long conversation with a neighboring owner who manages a couple dozen investment homes himself. The discussion wandered through every corner of Phoenix real estate, but he kept coming back to one theme: the housing market is going to crash by 2028.
His reasoning boiled down to this: “I saw downturns in 1988 and 2008. Crashes happen every 20 years. We’re due.” Sound familiar?
Rather than brushing it off, we pulled up the Phoenix Case-Shiller Index and Zonda’s latest market report to see if the fundamentals actually support that theory.
TLDR: they don’t. And the longer answer explains why.
Case-Shiller: 36 Years of Context
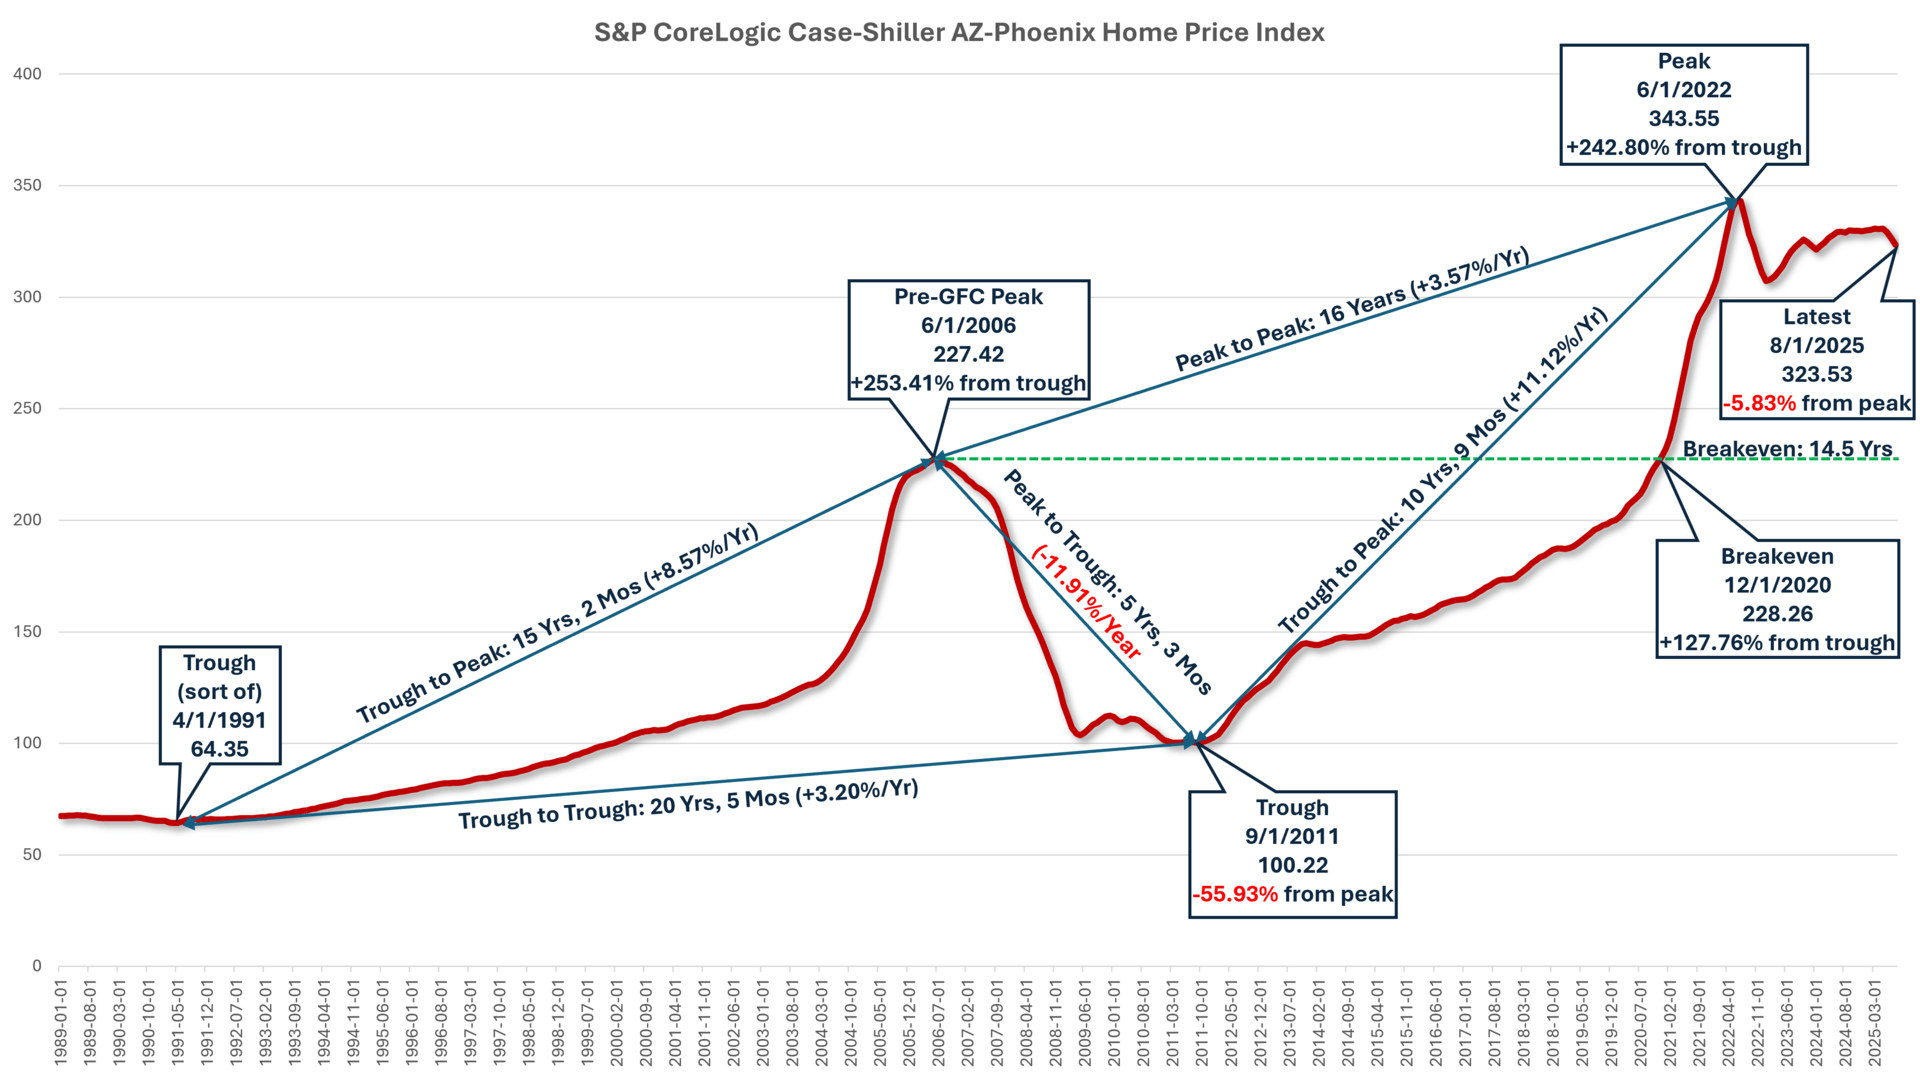
The Phoenix Case-Shiller Index from 1989 - 2025 shows both major cycles in clear detail:
2006 peak: 227.42
2011 trough: 100.22 (-56% decline)
Breakeven: December 2020 - 14.5 years to recover
2022 peak: 343.55
Latest (Aug 2025): 323.53 (only -5.8% below 2022 peak)
The 2000 - 2006 run-up was a classic bubble built on subprime credit, speculative buying, and overbuilding. The collapse was equally vertical.
The 2012 - 2022 expansion, by contrast, is long and steady:
Tight underwriting
Fixed-rate mortgages
Under-built supply
Migration pressure
High down payments
Institutional cash buyers
Nothing about the current curve resembles the pre-GFC parabola (click the graph below fora an enlarged version.
Zonda’s Latest Report Gives the Real-Time View
The Zonda November 2025 report for the Phoenix Metro fills in the on-the-ground details.
1. Demand is still there — in a big way
Annualized observed closings in 2Q25 were the highest since before the GFC.
That’s not what a market on the brink looks like.
2. Starts are down heavily
Annualized starts fell 14.7% year-over-year and remain far below 2021–2022 levels.
Crashes come from oversupply. This is undersupply.
3. Zonda projects only a slight oversupply by 2027
Today: 1.7% undersupplied
2027: 0.5% oversupplied
In other words, a balanced market, not a glut.
4. Prices are basically flat
New median: $473,490 (-3.4%)
Existing median: $440,000 (+1.1%)
Flat prices + low starts is not a bubble.
What About Distress? This Is Where 2025 Differs From 2006–2008
This is the only part of the report that could raise eyebrows and it should be interpreted correctly.
Notices of Default (NODs)
August 2025 NODs: 106
Up 49.3% YoY
That sounds dramatic, but the absolute number is tiny in a metro with nearly 2 million households. A rise from a very low baseline is still a very low baseline.
Foreclosures
39 in August
Up 200% YoY, but still only 0.5% market share
Again - meaningful movement, but not meaningful levels.
The key difference from 2008:
Borrowers today are sitting on fixed-rate mortgages, high credit scores, and record equity. Rising NODs today reflect affordability strain, not systemic credit collapse.
In 2007, NODs were the leading edge of a structural failure.
In 2025, they’re an affordability pressure release valve, not a fuse.
Population, Jobs, and Households Continue Growing
Phoenix’s growth engine remains intact:
Population: 5.24M (+1.1% YoY)
Households: 1.96M (+1.7% YoY)
Households projected to grow another 1.9% by 2028
Median household income: up 3.0% YoY to $90,450
People are still coming. Jobs are still being created. And rooftops are still undersupplied.
Those are not crash conditions.
So… Will There Be a 2028 Crash?
Our best guess? The market will mostly grind sideways until incomes rise and/or interest rates come down to a level where the market price of homes is in line with the income-supported price.
Could we see:
Flat pricing?
Mild declines in certain submarkets?
Slower absorption?
Developer margin compression?
Higher distress in specific niches?
Yes.
But a GFC-style collapse requires oversupply + bad credit + forced selling + lender panic. We don’t have that mix today.
If the economy stumbles in the next few years, the damage will likely come from:
Commercial debt maturities
Regional bank tightening
Insurance inflation
Development feasibility
Affordability ceilings
Not from a residential credit implosion.
The Bottom Line
The Case-Shiller chart shows a market that is cooling after 2022, not breaking.
The Zonda report shows a market with solid demand, constrained supply, modest pricing pressure, and very low absolute levels of distress.
A “20-year cycle crash” makes for a clean story.
But the data tells a different one: Phoenix isn’t replaying 2008 (or 1988).
If a downturn comes, it won’t be because history is on a timer.
It’ll be because capital markets crack somewhere else first.
Thanks for reading, as always, please reach out with anything we can help you with.
Thanks,
John & Ramey
John Finnegan Senior Vice President | Land (602) 222-5152 | Ramey Peru Senior Vice President | Land (602) 222-5154 |
