


July 2026 Residential Permit Snapshot
Hi everyone, below are the updated Phoenix Metro permit numbers through July.
Something we noted in the most recent numbers - the combined trailing 12-month count just slipped below its long-term average for the first time since November 2019, which ends a 79-month run above the line. That streak covered the entire post-COVID cycle.
As always, we lean on the trailing 12-month numbers rather than the monthly prints. Any single month can swing on one big apartment project and that noise tells us almost nothing. The T-12 is where the trend actually means something.
Multifamily
The Macro View (2000 - today)
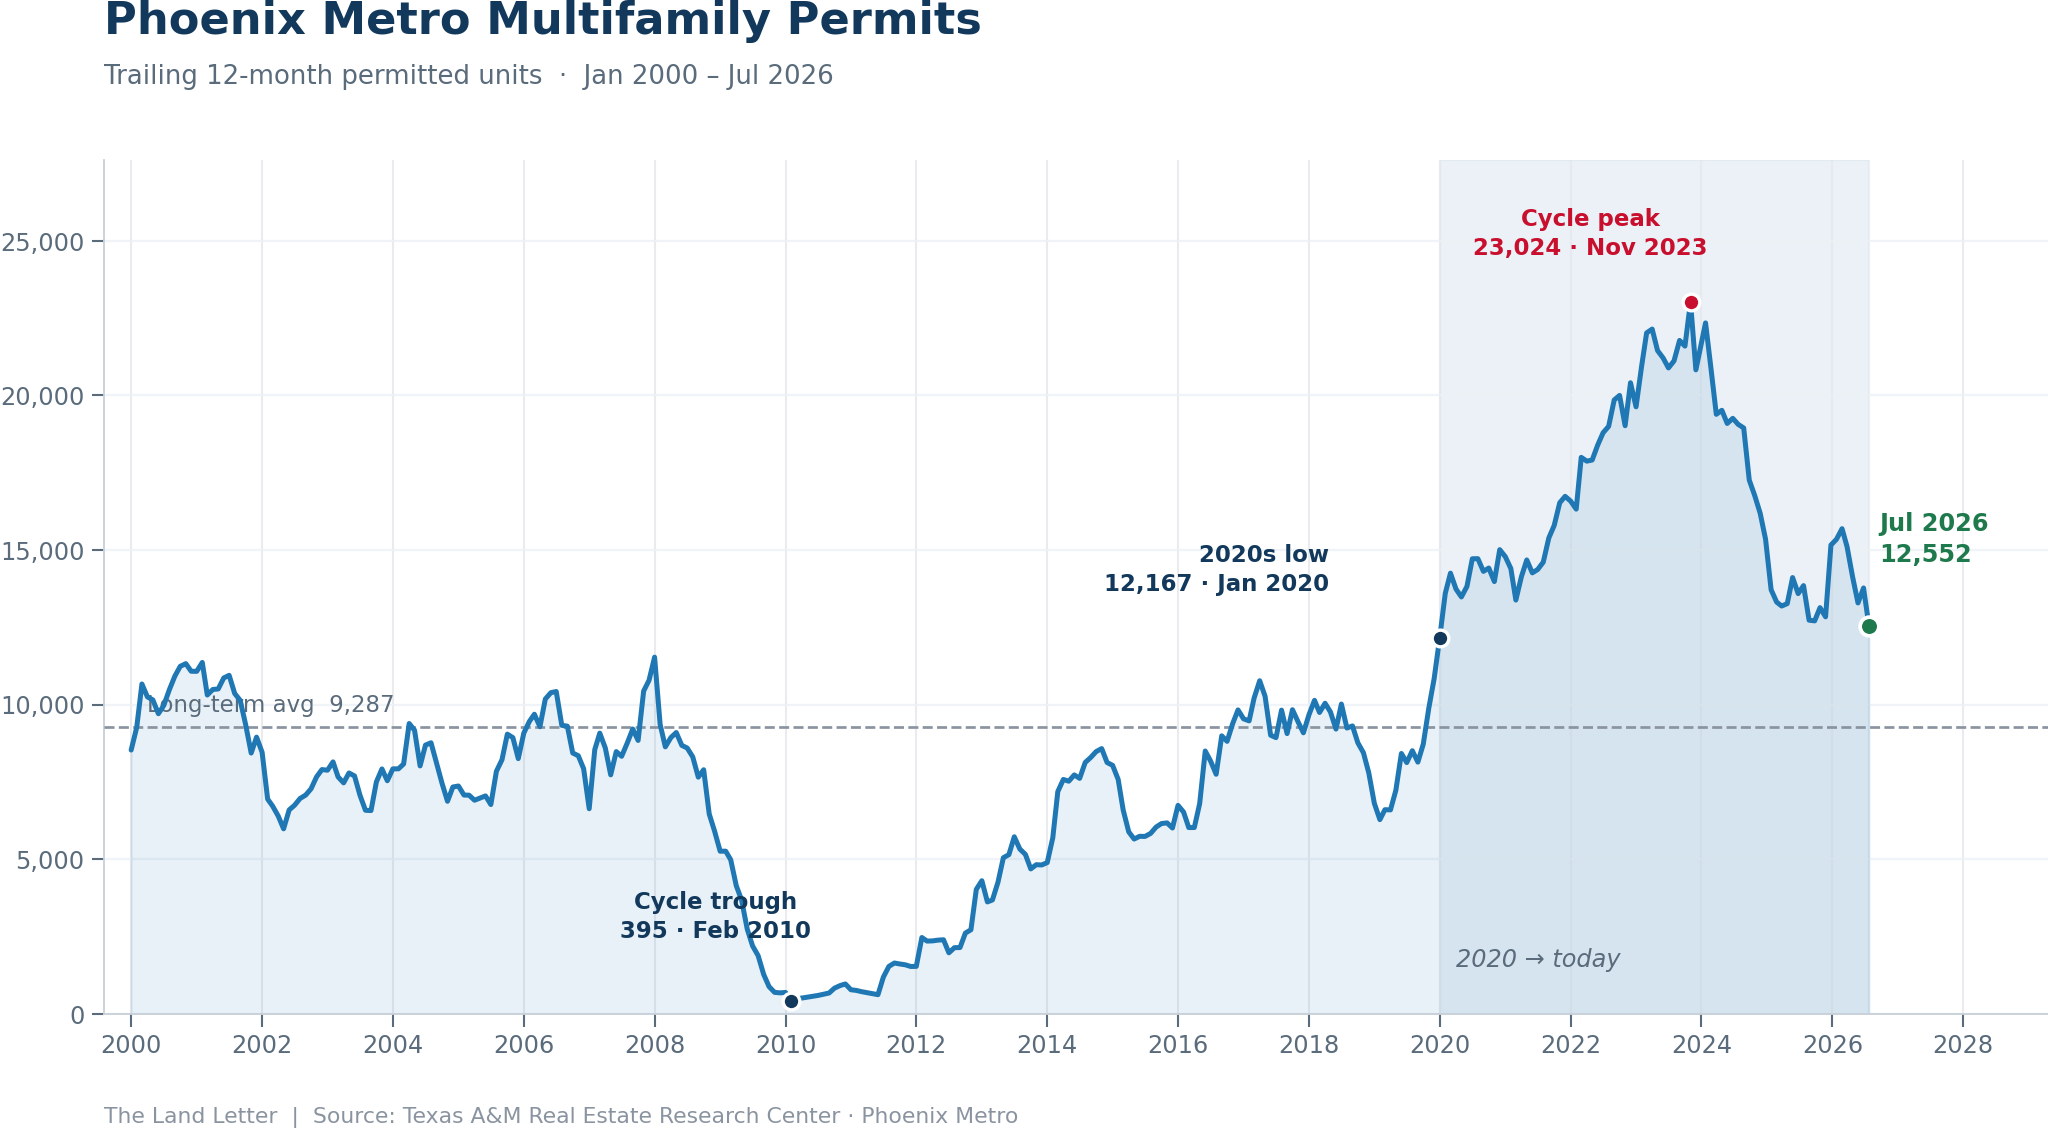
The multifamily T-12 sits at 12,552 units, down 9.4% year over year. Zoom all the way out and that’s still a strong number, the long-term average since 2000 is 9,287, so we’re running about 35% above the historical norm.
The full-cycle peak was 23,024 in November 2023, and the trough was 395 units in February 2010. Phoenix effectively stopped permitting apartments for the better part of two years after the GFC.
Another other macro fact we took note of: multifamily now makes up 36% of all residential permits vs. a long-term average of 26%. Even after the pullback, multifamily carries more of the load than it historically has.
The Micro View (2020 - today)
Inside the 2020s, we’ve now come full circle. The T-12 ran from roughly 12,200 units at the start of 2020 up to that 23,024 peak in late 2023, then rolled over. We’re now 45% off the peak, the sharpest drawdown in the series since the GFC.
At 12,552, the T-12 is back to where it was in January 2020.
One caveat: there was a genuine bump from December 2025 through February 2026, where the T-12 climbed back to 15,690. That’s since given way, and July’s number is the lowest reading of the 2020s. But it’s a reminder that a couple of large projects can move this line meaningfully in either direction.
Single Family
The Macro View (2000 - today)
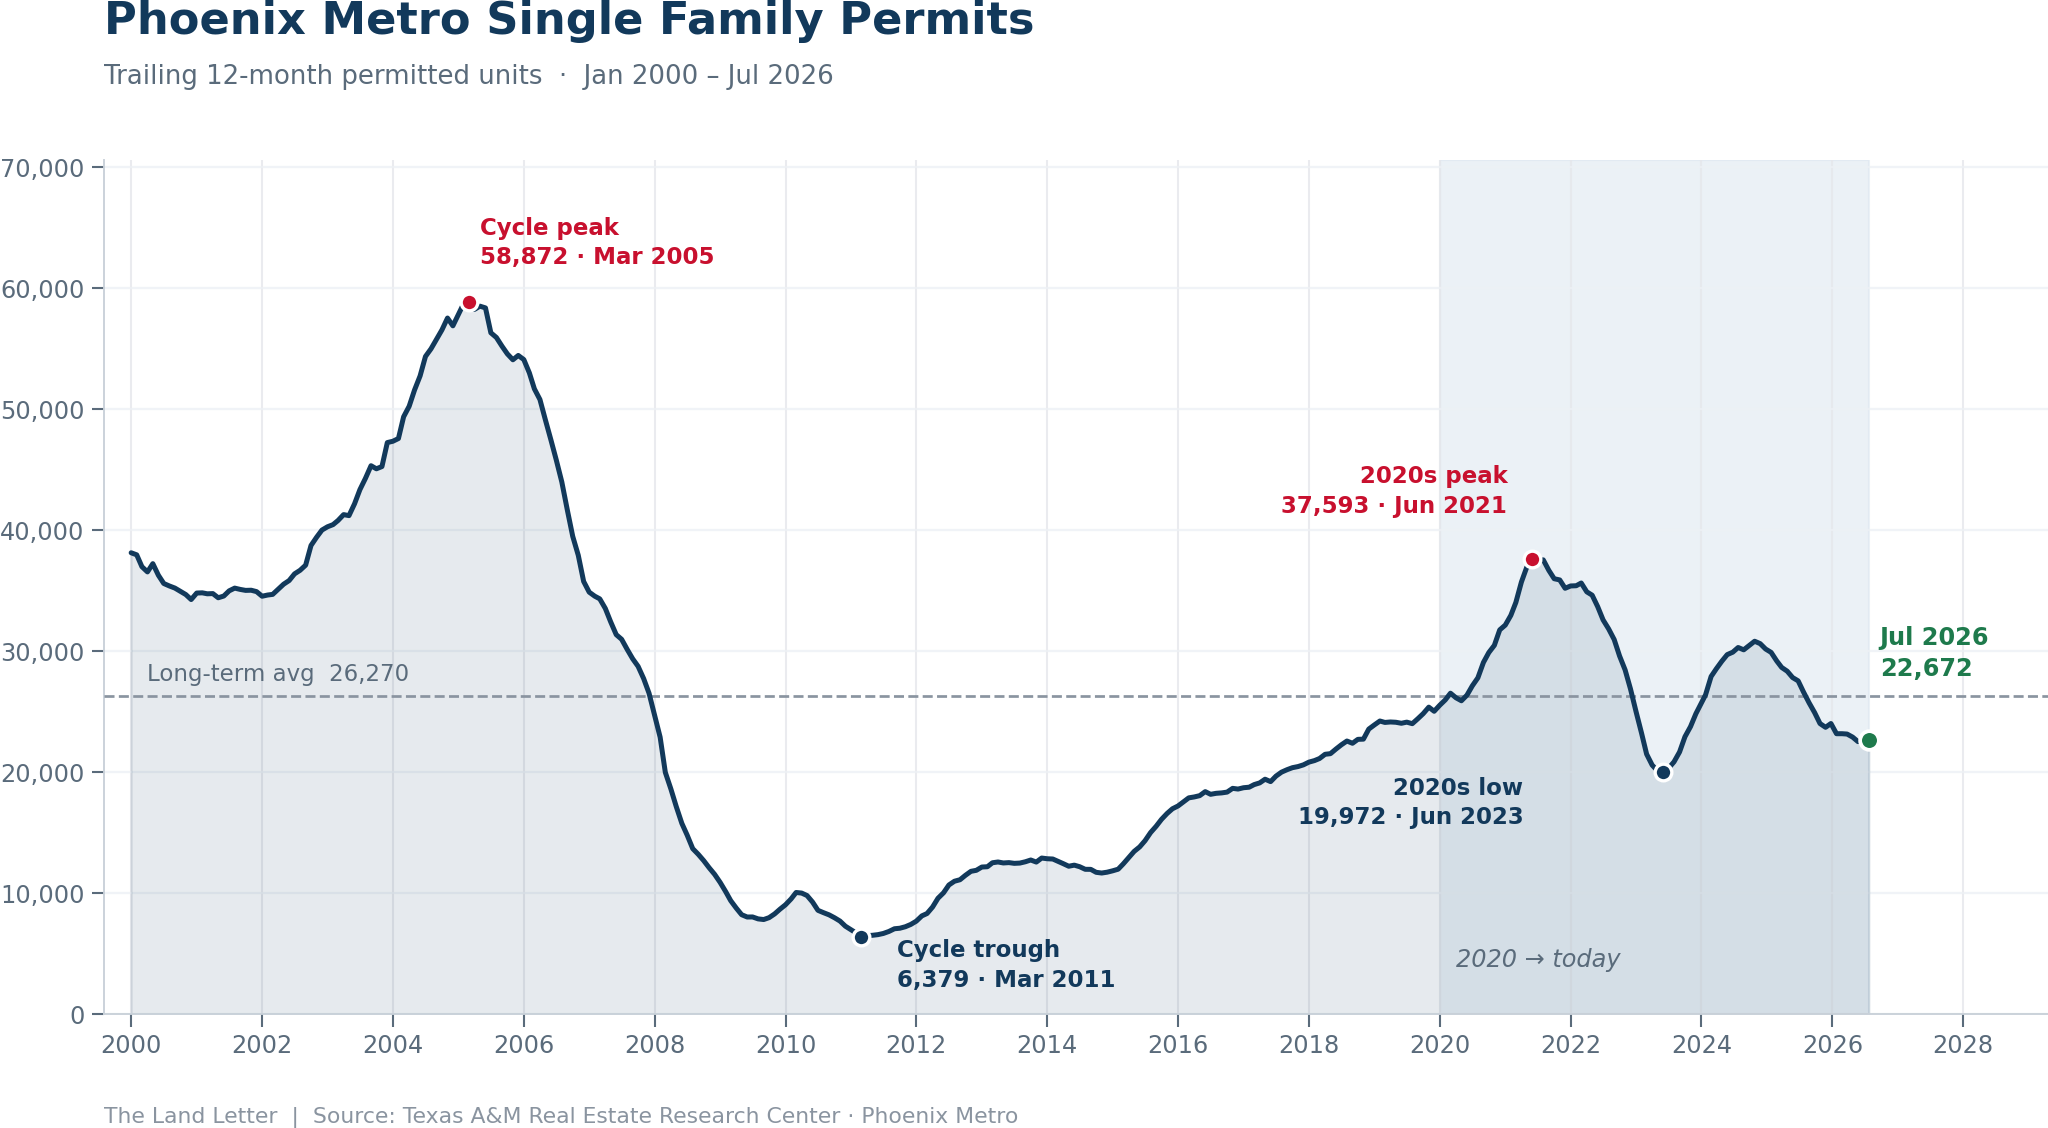
Single family is at 22,672 on the T-12, down 14.8% year over year and sitting about 14% below the long-term average of 26,270.
The macro chart is still dominated by two extremes. The 58,872 peak in March 2005 remains a number this market has never come close to revisiting (we’re at roughly 39% of it today). The 6,379 trough in March 2011 was a near-total shutdown of homebuilding in the Valley.
Worth noting that the last fifteen years have been a long, grinding climb from that trough, and even at the 2021 high we only got back to about two-thirds of the 2005 peak.
The Micro View (2020 - today)
The 2020s have given us a double top. The T-12 peaked at 37,593 in June 2021, fell to a low of 19,972 in June 2023 as rates repriced everything, recovered to 30,807 by October 2024, and has been declining since. We’re now 26% off that secondary peak.
When we look at the last four T-12 numbers, we get 22,878, 22,504, 22,635 and 22,672. Those numbers are remarkably flat and it looks like we’re seeing some stabilization after a steady twenty-month slide.
Combined
The Macro View (2000 - today)
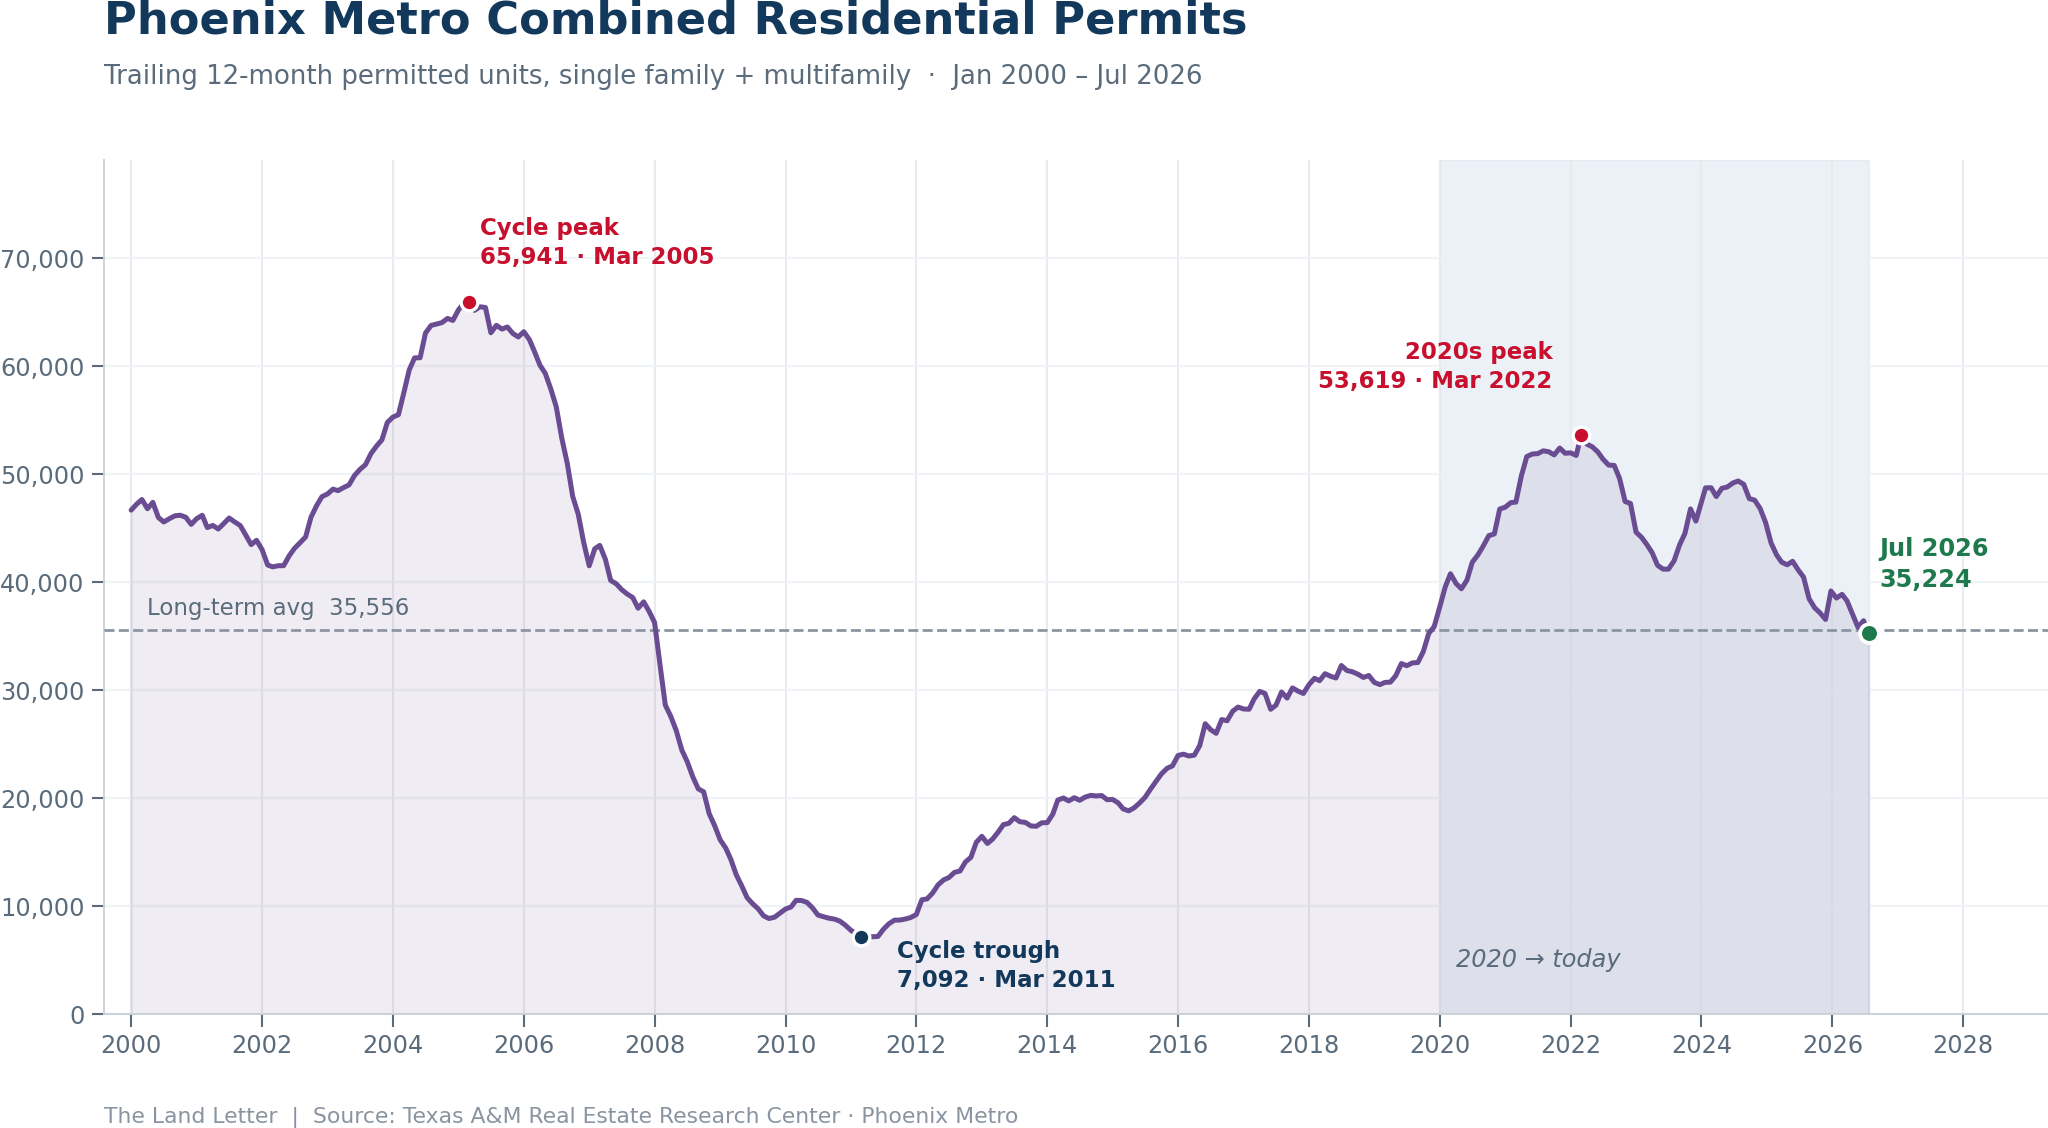
Combined residential permits stand at 35,224 on the trailing 12, down 12.9% year over year.
The long-term average is 35,556. So we are right at the historical average (0.9% below if you want to get technical about it). The broader cycle peak was 65,941 in March 2005 and the trough was 7,092 in March 2011.
To be clear, the 2000–2026 window includes one of the largest housing bubbles in American history and one of the largest busts, and the average of that series is a reasonable definition of a normal year in Phoenix. We can also see from the graph how rare it is for us to be sitting right at the average.
The Micro View (2020 - today)
Within the 2020s, this is the low. The combined T-12 peaked at 53,619 in March 2022 and has fallen 34% to today’s reading. July 2026 is the lowest combined count since October 2019.
Single family peaked in mid-2021, multifamily peaked in late 2023. The two sectors rolled over eighteen months apart, and that stagger is what kept the combined line elevated for so long. Multifamily was doing the heavy lifting through 2023 and into 2024. Now both are coming down at the same time, so the combined number has nothing propping it up.
What we’re actually watching from here: the decline in single family has stalled for four months and multifamily appears to still be coming down. If single family holds this level and multifamily trends down to the long-term average, the combined count would stabilize in the low 30s. To us, that feels like a market resetting to normal. The permit data has come all the way back to trend, which is uncomfortable after five years above it, but the trend is not distress.
Thanks for reading. As always, reach out with anything we can help you with - and if you’re looking at a specific submarket or a specific deal, we’re happy to dig into the numbers with you.
Until next time,
Ramey & John
Ramey Peru — Senior Vice President | Land — ramey.peru@colliers.com
John Finnegan — Senior Vice President | Land — john.finnegan@colliers.com
Data: Texas A&M Real Estate Research Center, Phoenix Metro, through July 2026. Multifamily figures reflect all multifamily permits (2-unit, 3–4 unit and 5+); the 5+ category makes up the large majority and stands at 11,495 on the current trailing 12.